Dataset Overview
RDDAC contains 9,000 physical deep-drawing and cutting experiments on DP600 dual-phase steel, forming modified quadratic cups on an industrial press. Each experiment captures deep drawing (OP10) followed by cutting (OP20) with four raw measurement modalities. The full release is ~87 GB (~9.7 MB per experiment, HDF5 + gzip).
| DOI | 10.18419/DARUS-5589 |
| Records | 9,000 experiments |
| Total size | ~87 GB |
| File size | ~9.7 MB per experiment |
| Format | HDF5 |
| License | CC BY 4.0 |
Parameter space
Three process parameters are varied on a full grid; every combination is a category repeated up to 500 times:
| Parameter | Values |
|---|---|
| Geometry | concave (ids 0000-4499), convex (ids 4500-8999) |
| Blankholder force | 100 / 300 / 500 kN |
| Oil type | coarse / medium / fine lubrication pattern |
2 geometries x 3 blankholder forces x 3 oil types = 18 categories x up to 500 repetitions = 9,000 experiments. Unlike DDACS, where every simulation has distinct input parameters, RDDAC's value lies in the repetitions: hundreds of nominally identical experiments expose the natural scatter of the physical process.
| Count | |
|---|---|
| Experiments (total) | 9,000 |
| per geometry (concave / convex) | 4,500 each |
| categories (geometry × force × oil) | 18 |
| without point cloud | 10 |
| without oil measurement | 123 |
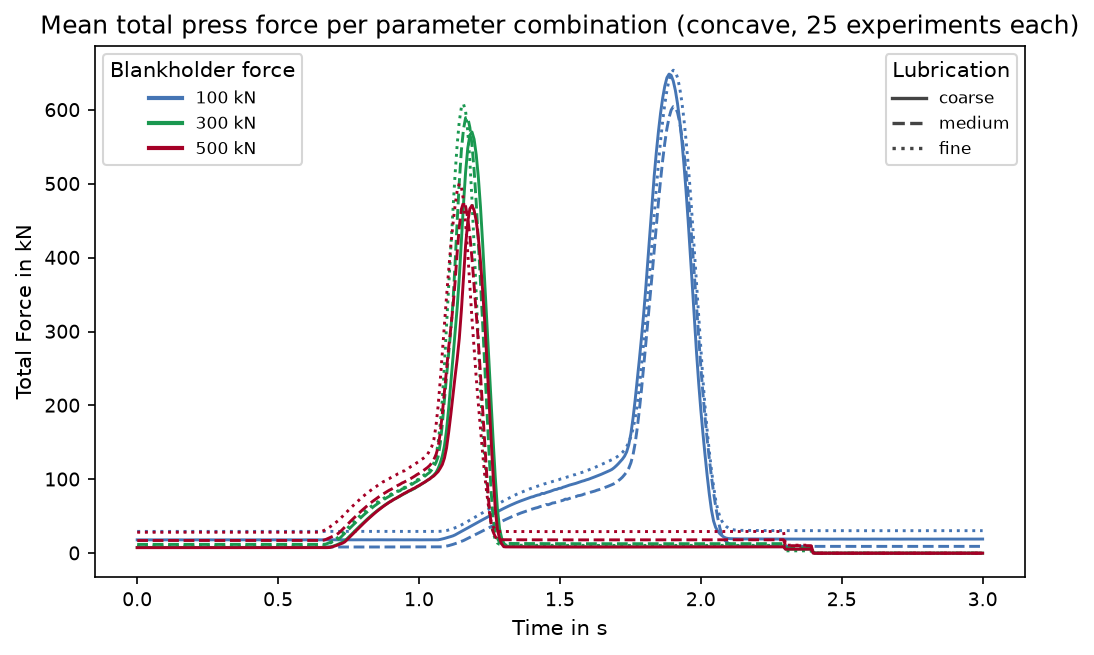
Total press force over time (concave geometry, mean of 25 experiments per combination), color encodes the blankholder force, line style the oil type.
Operations
Each experiment runs two operations end to end. OP10 is the deep drawing step: the blank holder presses the sheet against the die, the punch travels down, and the tools are released. OP20 then cuts the formed cup. The part is laser-scanned after each operation, so both intermediate and final geometry are captured.
Measurement modalities
Four raw modalities are recorded per experiment (see HDF5 structure for exact shapes and units). The single-experiment figures below all show experiment 0000; the traverse heatmaps show category 2 (concave, 100 kN, fine oil).
Press force signals: four load cells positioned around the forming die sample the force at 300 Hz while the punch descends in OP10. The same table carries the punch temperature, the punch position, and the summed total force, so one figure shows the complete press state over the stroke:
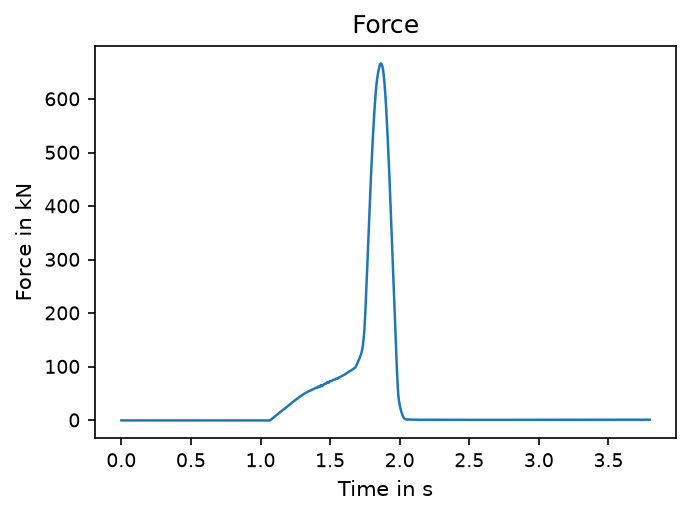
Press force signals of experiment 0000: the four load cells, their total, and the punch position and temperature over the stroke.
Across repetitions the force signals also expose slow process drift, such as the punch warming up over the course of a measurement campaign:
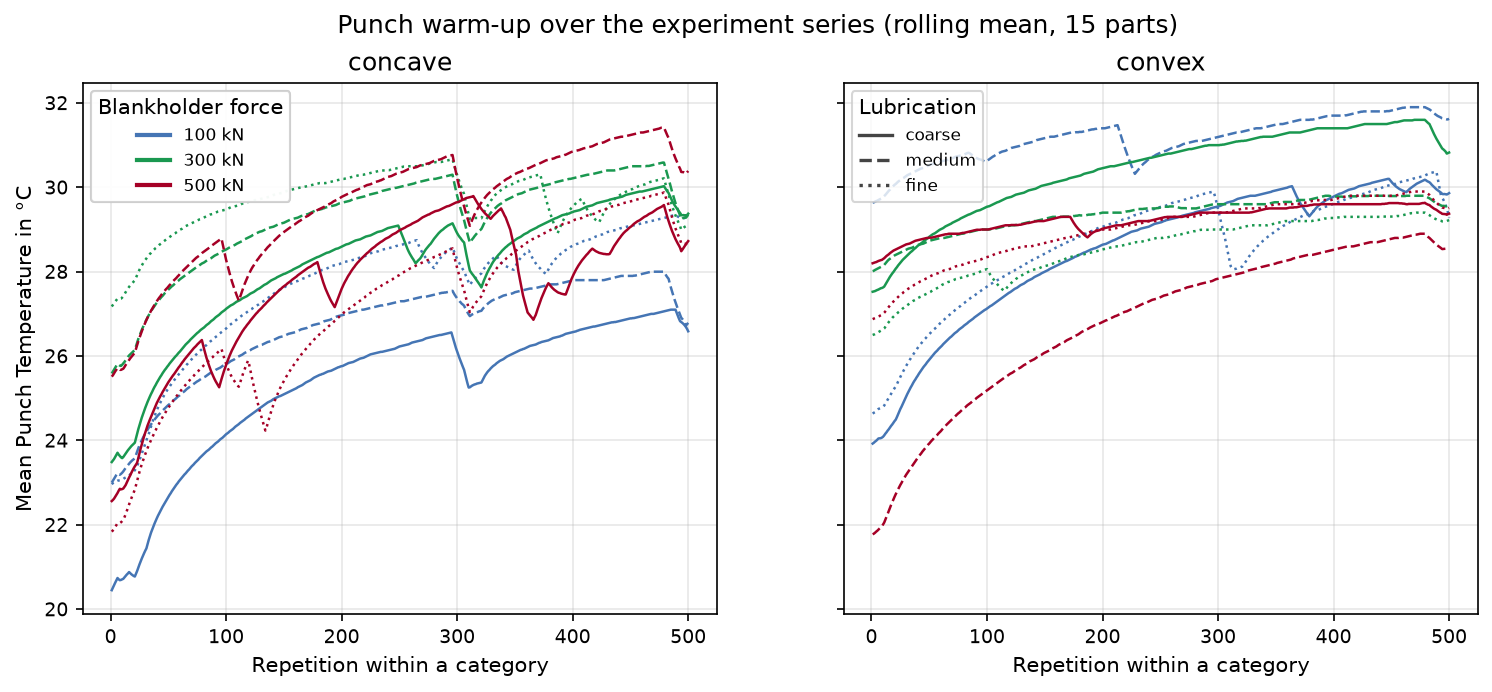
Punch temperature over repetitions, one panel per geometry, color encodes the blankholder force, line style the oil type.
Before forming, two line measurements are taken on the flat blank, the sheet thickness on the bare blank, the oil film after the lubricant is applied:
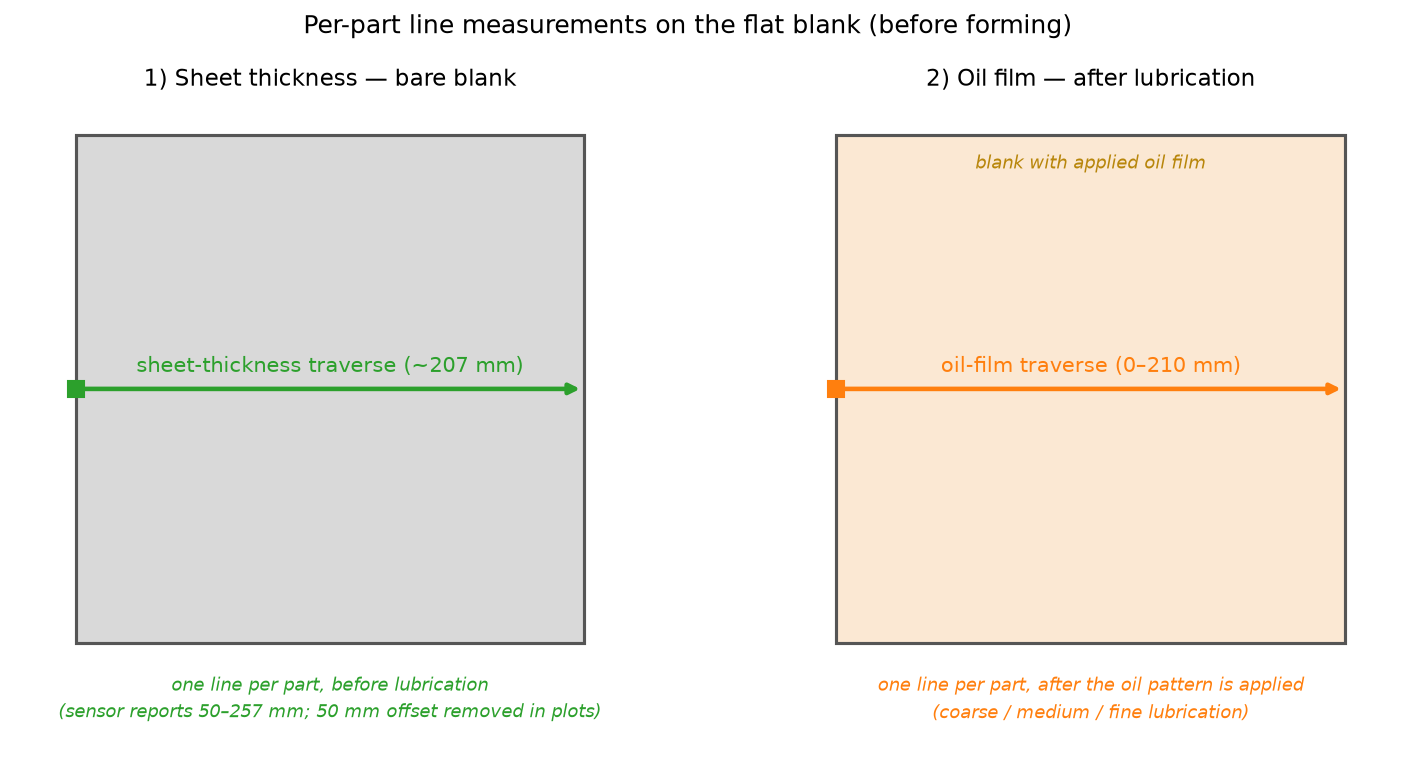
One measurement line per part on the flat blank: sheet thickness before lubrication, oil film after.
Sheet thickness traverse: a thickness sensor traverses the blank along that line and records the material thickness in µm, capturing the manufacturing tolerances of the sheet metal coil.
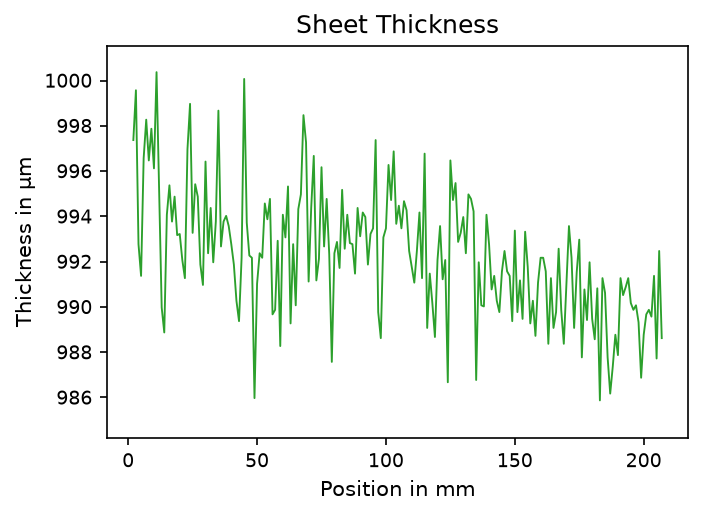
Sheet thickness traverse of experiment 0000.
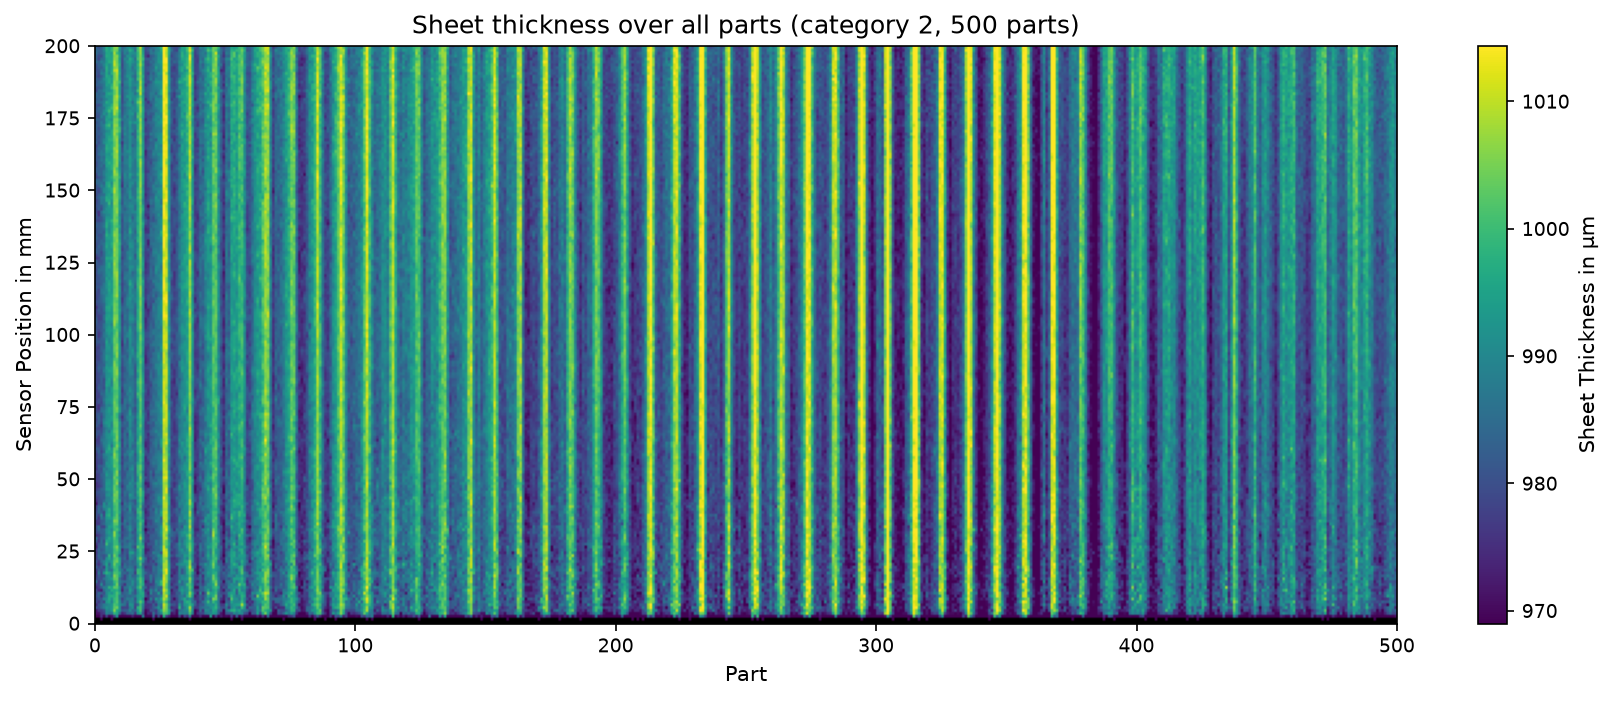
Sheet thickness traverses of all parts of category 2 side by side, the coil-to-coil variation of the raw material.
Oil film traverse: an AMEPA oil film meter traverses the lubricated blank and records the oil area density in g/m². The three oil types of the parameter grid differ in this applied pattern.
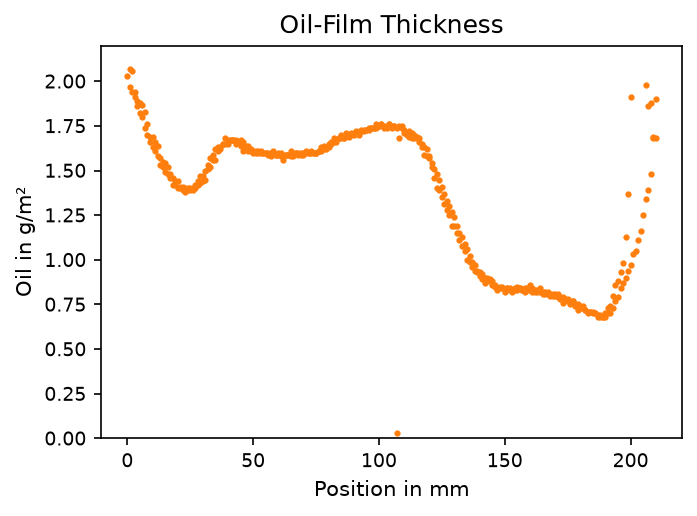
Oil film traverse of experiment 0000.
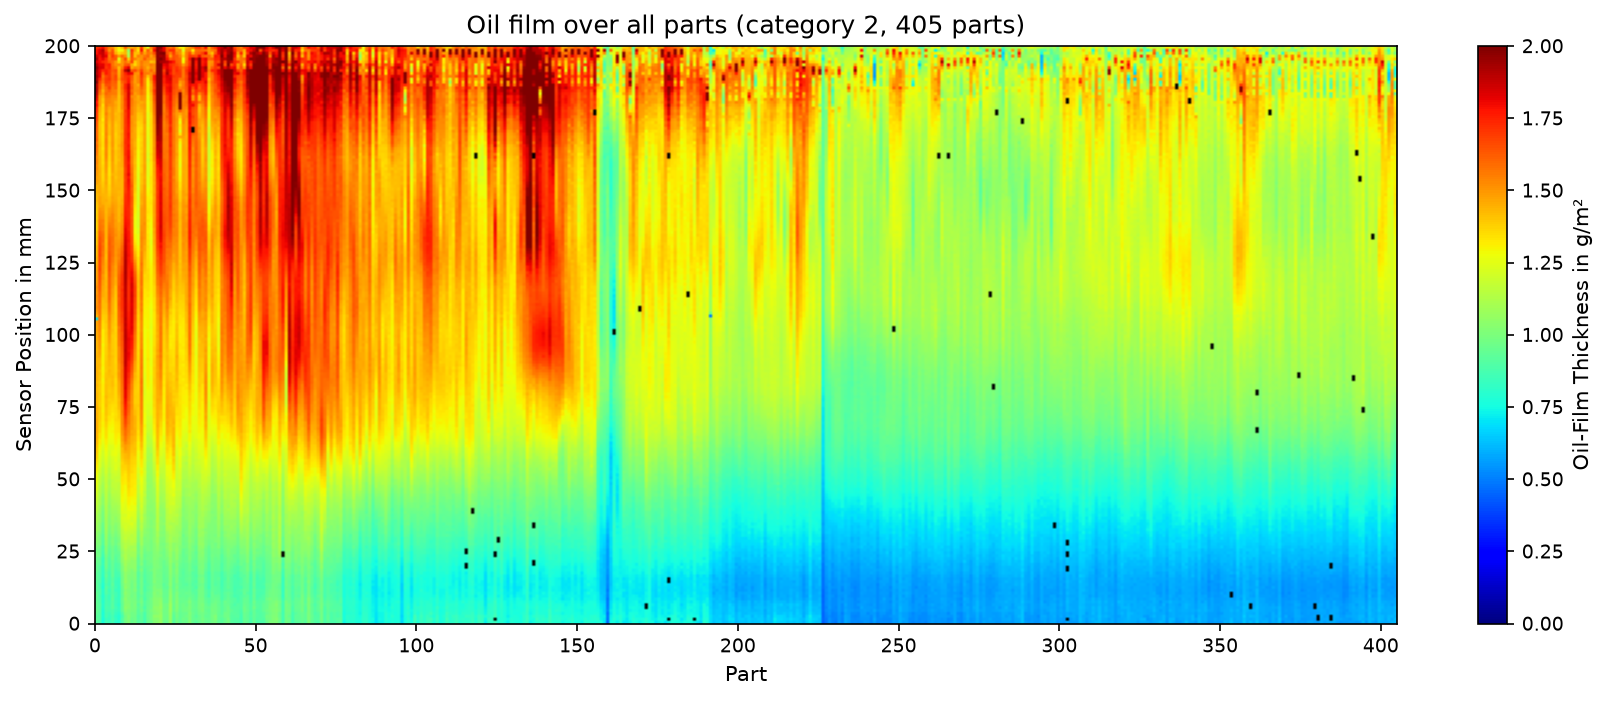
Oil film traverses of all parts of category 2 side by side, the scatter of the lubrication pattern across repetitions.
3D laser scans: a Keyence LJ-X8400 laser line scanner captures the formed part after deep drawing (OP10) and again after cutting (OP20), recording a height and a luminescence buffer on a 3200 x 2000 pixel grid (6.4 million points per scan).
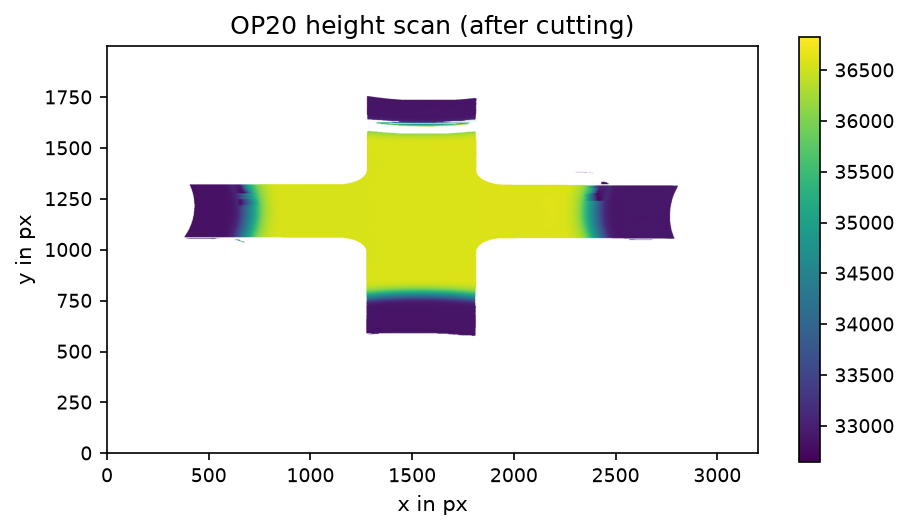
OP20 laser scan (height buffer) of experiment 0000, the cut cup on the magnetic gripper surface.
The same buffers plot directly as a 3D point cloud: rddac.scan_to_pointcloud turns a scan into (N, 3) points and rddac.plot_point_cloud renders them (see the visualization tutorial):
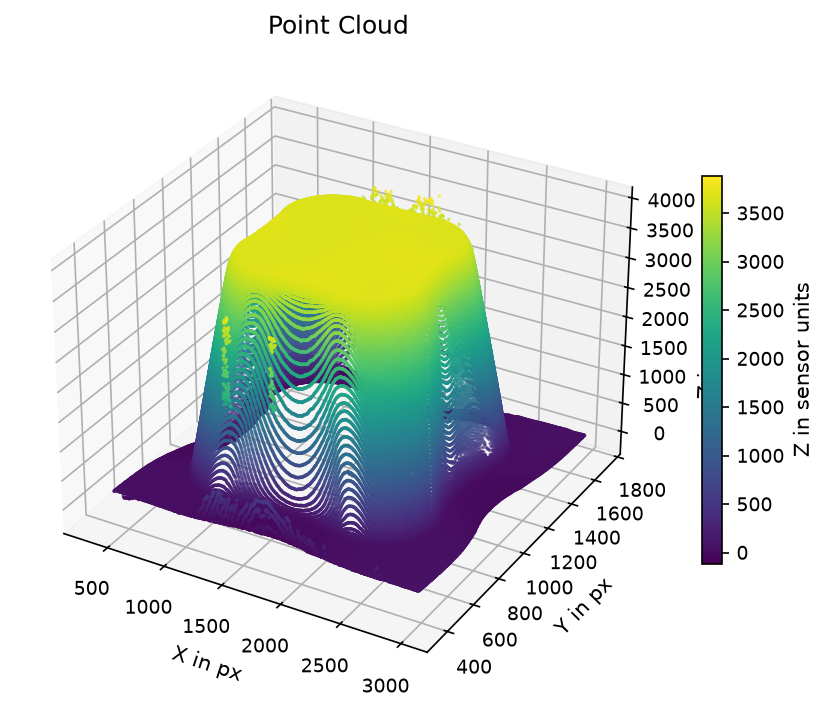
OP10 scan of experiment 0000 as a 3D point cloud. The sparse bands on the steep cup walls are pixels without a laser return, raw data, no cleaning applied.
Raw sensor data
The scan z and luminescence buffers are stored in uncalibrated sensor units, and the number of samples n in the force and traverse tables varies per experiment; this is deliberately the raw data as recorded. The optional preprocessing step (rddac preprocess) derives calibrated, cleaned, fixed-shape data into a separate processed layer; the published files stay raw.
Missing measurements
Not every experiment carries every modality. 10 experiments lack the point cloud scans and 123 lack the oil measurement. Two boolean columns in process_parameters.csv (mirrored as HDF5 root attributes) flag availability:
| Flag | False count |
Missing HDF5 group |
|---|---|---|
has_pointcloud |
10 | pointcloud/ |
has_oil |
123 | oil_thickness/ |
Filter them out before streaming a view that touches the affected groups, e.g. where=lambda row: row["has_oil"], see Process parameters.
Relationship to DDACS
RDDAC is the experimental counterpart to the DDACS dataset of LS-DYNA simulations: same modified quadratic cup, same DP600 steel, same two-stage OP10/OP20 process. The DDACS release contains a matching sub study (the rddac column of its process_parameters.csv) whose simulations correspond to the RDDAC parameter grid; they are published in the DDACS dataset as a single archive, rddac.zip (~9 GB, doi:10.18419/DARUS-4801).
rddac download fetches those simulations alongside the measurements into ./data/simulation by default; pass --no-sim to skip them. The accompanying paper, Statistical Analysis of Simulation to Reality Deviation in Deep Drawing with a Benchmark Dataset, characterises the deviation between the two.
The rddac package API mirrors ddacs one to one, so analysis code moves between the two datasets by swapping the import.
Files on DaRUS
| File | Size | Contents |
|---|---|---|
process_parameters.csv |
~447 KB | Per-experiment parameter table; join to HDF5 files via index. |
concave.zip |
~45 GB | Raw experimental measurements for the concave geometry (4491 experiments). One HDF5 file per experiment. The 9 concave experiments shown in sample.zip are not repeated here. |
convex.zip |
~42 GB | Raw experimental measurements for the convex geometry (4491 experiments). One HDF5 file per experiment. The 9 convex experiments shown in sample.zip are not repeated here. |
sample.zip |
~174 MB | Small sample (one experiment per category, 18 files) for quick tryout and testing without downloading the full dataset. These experiments are not repeated in concave.zip / convex.zip. |
metadata.json |
The Croissant 1.1 manifest — the machine readable schema of this table and everything in the HDF5 files. | |
rddac_documentation.pdf |
Standalone dataset documentation. |
The names, sizes, and descriptions above come from the Croissant manifest, which is generated from the DaRUS file records. The three zips partition the 9,000 experiments: the 18 ids in sample.zip are not repeated in the geometry zips. HDF5 members are zero-padded to four digits (experiment 42 -> 0042.h5).
Further reading
- Process parameters: categories, splits, and the columns of
process_parameters.csv. - HDF5 structure: every field, shape, and unit inside one experiment.
- Croissant manifest: the machine readable schema the package and external tools read.